
What Are Support and Resistance + How Can You Find Them on a Chart
One of the first things that every trader needs to learn, is how to find support and resistance on a chart. Doesn’t matter if you want to trade cryptocurrencies, forex or the stock market, finding support and resistance is a must in any kind of securities trading. So if you want to start your journey to learn technical analysis, this can be good start.
But first, a note: If you have a firm grasp on the concept of supply and demand and their relationship with price, read on. If not, you should read this post first.
How does price go up or down in crypto?
When the amount of supply is more than the amount of demand, the price will go lower. (This is pressure from the sellers who are willing to sell for less and less.) And when the amount of demand is more than the amount of supply, the price will go higher. (This is pressure from the buyers who are willing to pay more and more.)
This is the law of supply and demand and it happens in every securities market, not just the crypto market.
So if you can guess which one will be higher at a certain price level, the amount of supply or the amount of demand, you can trade accordingly. If you guess that the quantity demanded will be greater than the quantity supplied, you’ll go long. But if you guess that the amount of supply will be more than the amount of demand, you’ll short the asset. (If you don’t know what long and short mean in this context, you should read our guide to long and short positions.)
But of course there are things that can shift supply and demand as a whole.
So how can you guess if the price will go up or down and how much?
There are many things that can influence supply and demand in the crypto market, things like good or bad news, amount of income and credit people have access to, level of adoption and more. And when supply and demand change, the equilibrium changes. This means that the price will change too, in order to reach for the new equilibrium.
Other than this, you’ll kind of just have to guess about the current equilibrium.
Note: If you look at the crypto fear and greed index, more fear will mean less demand and more greed will mean less supply.
One of the simple things that everyone can use to guess how much the price of a particular security or asset will move, is its history. The saying that “history repeats itself” is very true when it comes to prices. And this is exactly where support and resistance come into play to give us an idea about how much the price can go up or down.
What is support in technical analysis?
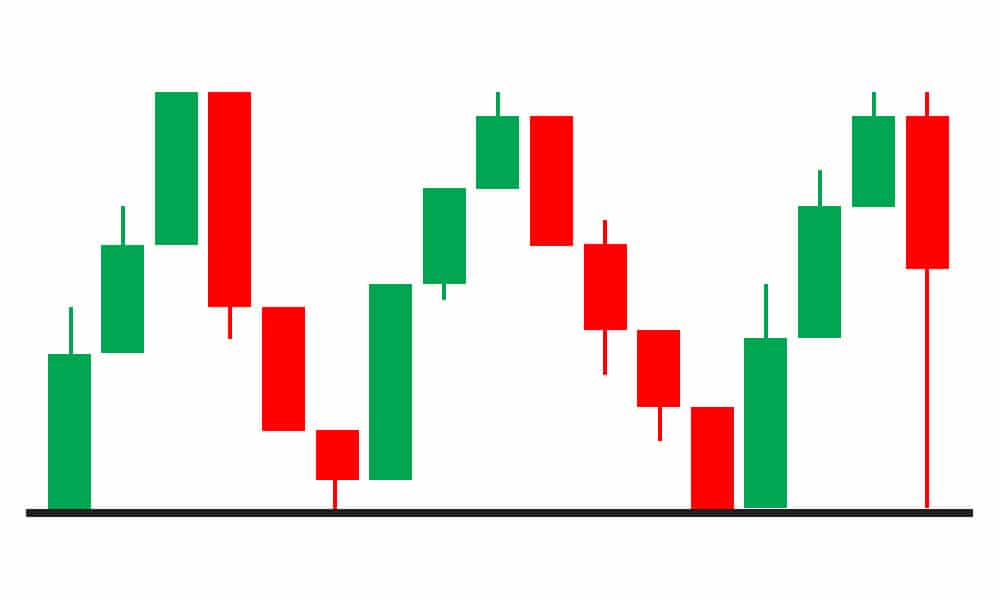
Support is a level of price in which the buyers come in with their demand and prevent the price from going down any further. So if the price has been going down, it should stop at this level for a while and maybe even start going up after hitting it. (This is also called a down-trend reversal.) You can find different levels or areas of support by looking at the price action on any chart.
For example, if we had a chart like this, our support would be the horizontal line at the bottom:
What is resistance in technical analysis?
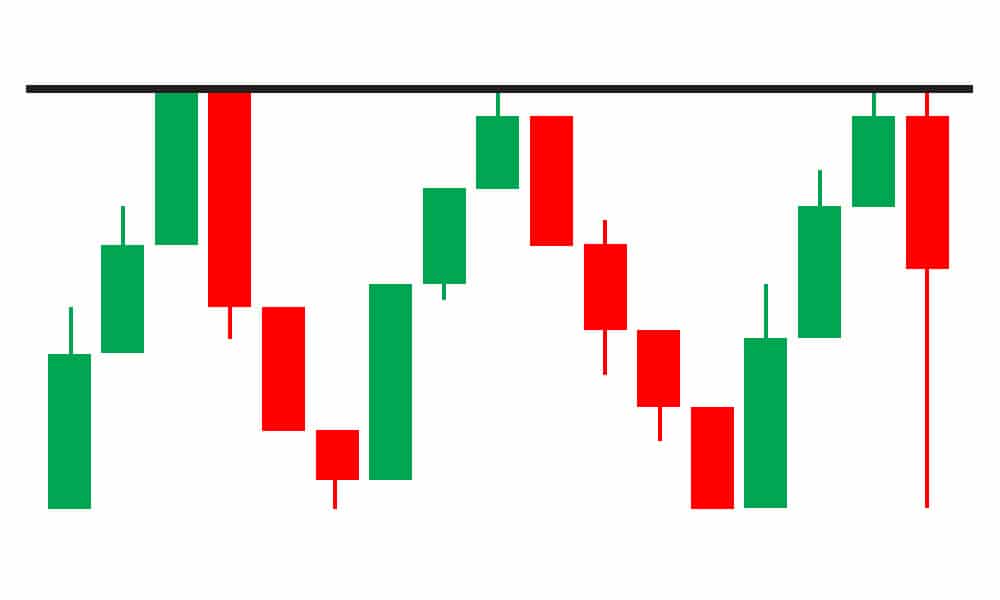
Resistance is a level of price in which the sellers come in with their supply and prevent the price from going any higher. So if the price has been going up, it should stop at this level for a while and maybe even start going down after hitting it. (This is also called an up-trend reversal.) Similar to support, you can find different levels or areas of resistance by looking at the price action on any chart.
If we go back to our example, our resistance would be the horizontal line at the top:
Note: You can rarely find this kind of clean setup in real markets. So if you want to become better at finding support and resistance levels, you should go to a site like tradingview and practice. Draw support and resistance lines and save your setups. After a while, go back to see if the price movement has validated you setup or not.
Are support and resistance lines always horizontal?
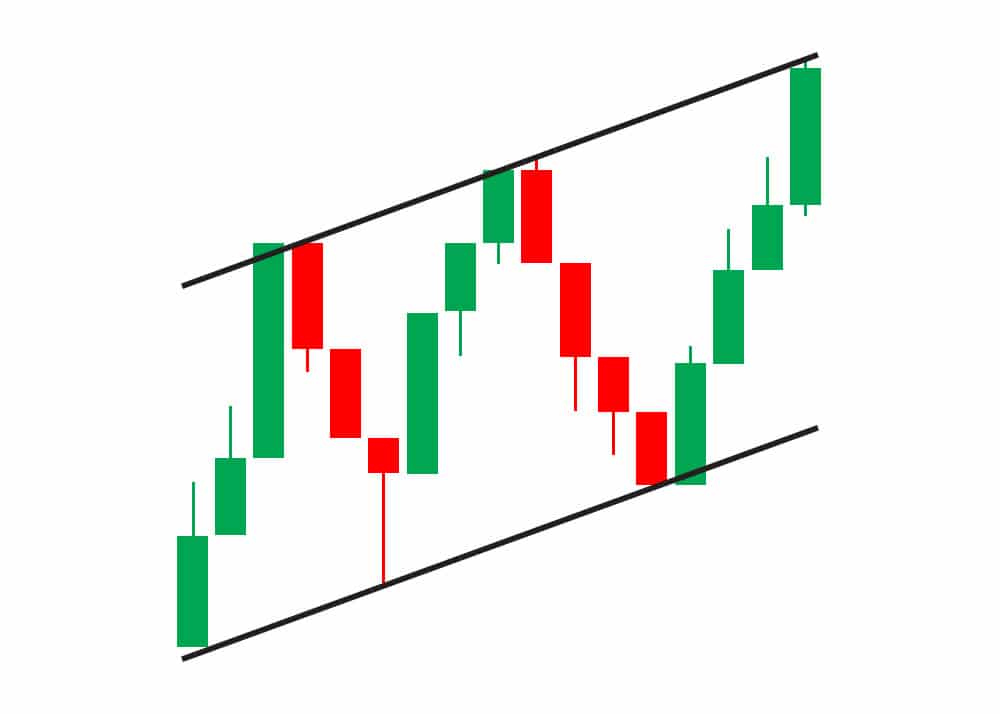
No. You can draw descending or ascending lines that work as support or resistance. These are also called trend lines sometimes. Because they show an uptrend or downtrend in the price movement. Although they are not the only type of trend lines. Here’s an example:
Are support and resistance always lines?
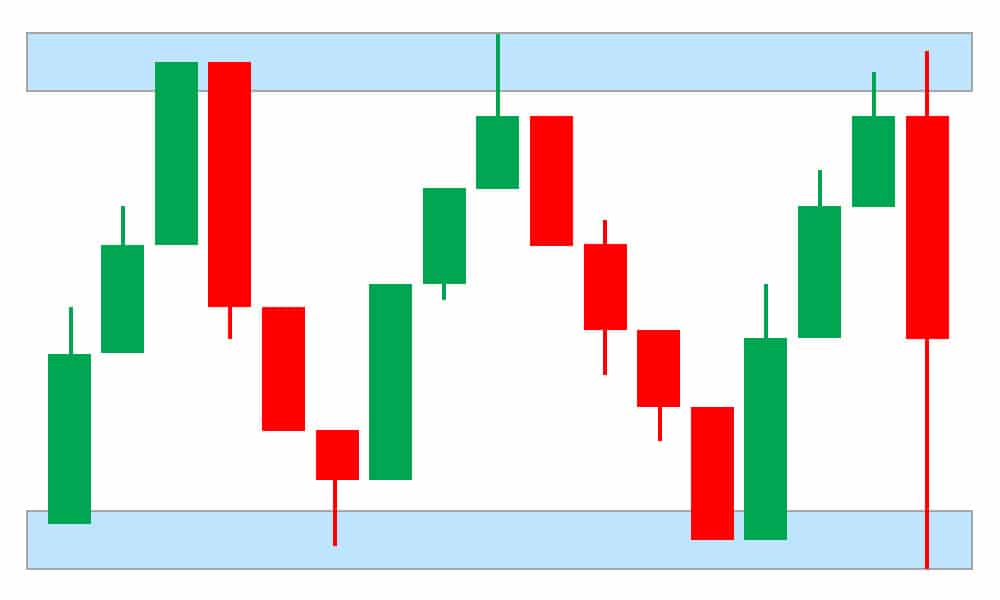
Some people always draw lines, but some others prefer to draw two lines and have a whole area of support and resistance. It’ll depend on your personal preference in technical analysis. If you do it enough times, you will find what works best for you. But drawing an area of support or resistance instead of a line, is definitely not wrong. It’ll look something like this:
Are support and resistance lines only drawn on the daily candle chart?
No. You can find levels of support and resistance on any time-frame on any kind of chart that shows the price for a tradable asset. You can draw these levels on a line chart as well.
Can you have multiple levels of support and resistance?
Yes. In fact, this usually is the case.
Why do support and resistance work?
The main reasons are amounts of supply and demand which in this case are most affected by the psychology of trade. Let’s say for example, that you have bought an asset at the price of 10 dollars. And you want to hold it so you can take more profit when selling. Now imagine that the price goes to 15 dollars, you don’t sell and it comes back down. What would you do? You will either sell a bit lower to make sure that you sell in profit or you will hold it for a longer time.
Let’s say that you hold your position or sell it in profit to buy back in case it gets lower and you do actually buy back at a lower price. Now if the price goes back up to reach 15 dollars again, what will you do? The probability of you selling at this price is much higher than before. Because you have experienced a peak at that price.
If you sell at 15 dollars and the price does come back down again, you’ll become more certain. You may buy lower again to sell at this point again. And this is how a resistance level is born! At resistance, many traders will think -based on the history of price action- that this price is high enough for this particular asset at the moment.
The opposite happens when a support is formed. For example, you may want to buy an asset but if you think the price will go lower, you’ll usually wait. Now if it goes to 10 dollars and you don’t buy only to see it rise again, the likelihood of you buying if it hits that level again, is much higher.
One other thing! If every trader believes that something will work, it can become a self-fulfilling prophecy. Because everyone will act accordingly, as if it will happen for sure. This is not always the case but you should bear it in mind.
Do support and resistance lines always work?
Nothing in trading works 100 percent of the time. This isn’t any different. If a support level is broken, it can become resistance. And if a resistance is broken, it can become support.
You should pay attention to the number of times the price has touched a level, the volume of trading at that level, the shape of the candles and some other things, to gauge the strength of a level of support or resistance.
Pin It!

Your turn
If you’ve found this post useful, let us know in the comments and share it with others to spread the knowledge! Thanks.
***Last Updated on 25 March 2022 by Hamed Derakhshani (Guy with a Wallet)


